All 14 questions, with what each one tests. Try any of them free in Gedara Sir to check your answer, with step-by-step working.
Data Representation and PredictionCount above a mark from a histogram with an unequal class
24 students
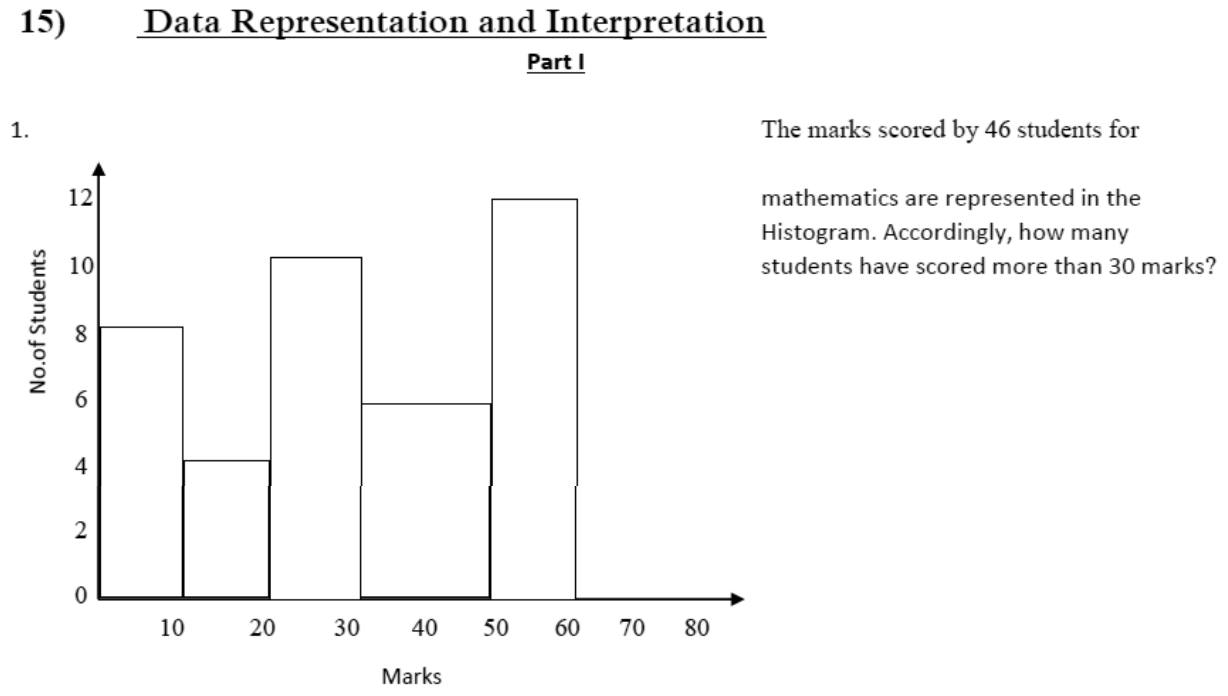
💡 What it's asking: When the bars of a histogram have different widths, the AREA of a bar (not just its height) tells you how many students are in it. Find the frequency of each bar above 30 and add them.
- Spot the standard (usual) class width and notice the 30-50 bar is twice as wide.
- For a double-width bar, frequency = height × 2 = 6 × 2 = 12.
- The 50-60 bar has the standard width, so its frequency is just its height: 12.
- Add the bars above 30 marks: 12 + 12 = 24 students.
✅ All the bars together give 8 + 4 + 10 + 12 + 12 = 46, which is the total number of students, so the readings are right.
සිංහලෙන් විසඳුම
හිස්ටෝග්රෑමයක තීරුවල පළල වෙනස් විට, සිසුන් ගණන පෙන්වන්නේ තීරුවේ උස පමණක් නොව එහි වර්ගඵලයයි. 30 ට වැඩි එක් එක් තීරුවේ සංඛ්යාතය සොයා එකතු කරන්න.
- සම්මත පන්ති පළල හඳුනාගන්න; 30-50 තීරුව එමෙන් දෙගුණයක් පළල බව බලන්න.
- දෙගුණ පළල තීරුවක සංඛ්යාතය = උස × 2 = 6 × 2 = 12.
- 50-60 තීරුව සම්මත පළලයි; එහි සංඛ්යාතය උසමයි: 12.
- ලකුණු 30 ට වැඩි තීරු එකතු කරන්න: 12 + 12 = සිසුන් 24.
Fraction above a mark from a histogram with unequal classes
7/12
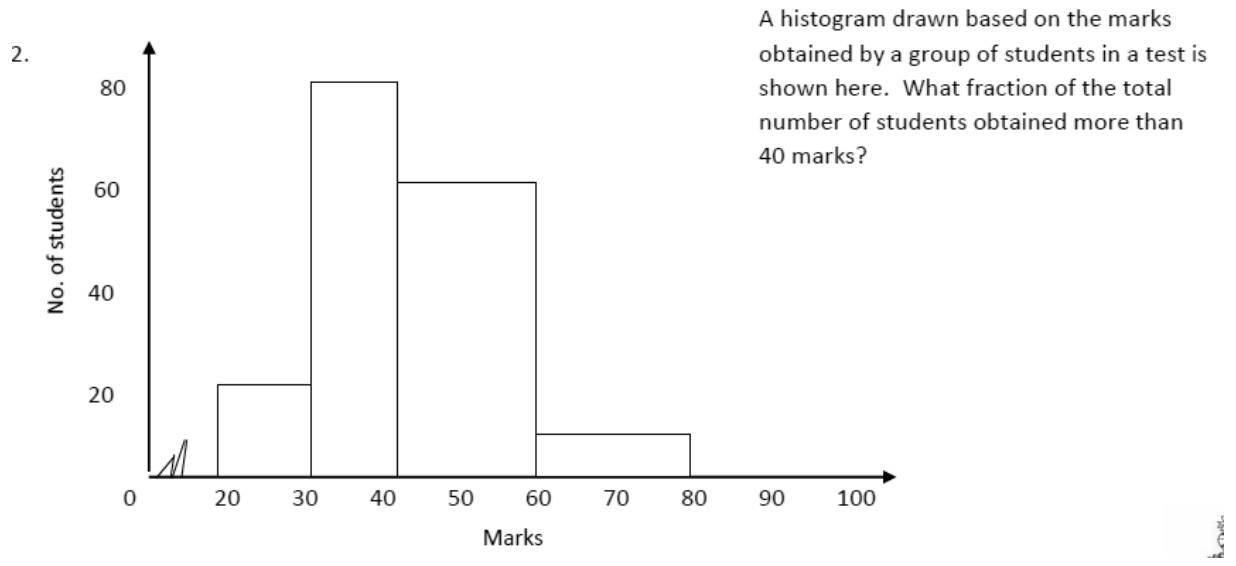
💡 What it's asking: We need the fraction of students who scored more than 40. Two bars are twice the standard width, so their frequencies are double their heights.
- Read the bar heights: 20, 80, 60 and 10. The standard width is 10 marks.
- The 40-60 and 60-80 bars are 20 marks wide (double), so their frequencies are 2 × 60 = 120 and 2 × 10 = 20.
- Total students = 20 + 80 + 120 + 20 = 240.
- Above 40 marks = 120 + 20 = 140.
- Fraction = 140/240 = 7/12.
✅ 7/12 is a bit more than a half, and the two right-hand bars do cover more area than the left two, so it makes sense.
සිංහලෙන් විසඳුම
ලකුණු 40 ට වැඩි සිසුන්ගේ භාගය සොයන්න. තීරු දෙකක් සම්මත පළල මෙන් දෙගුණයක් නිසා ඒවායේ සංඛ්යාතය උස මෙන් දෙගුණයකි.
- තීරු උස කියවන්න: 20, 80, 60, 10. සම්මත පළල ලකුණු 10 කි.
- 40-60 සහ 60-80 තීරු ලකුණු 20 ක් පළලයි (දෙගුණ); සංඛ්යාත 2 × 60 = 120 සහ 2 × 10 = 20.
- මුළු සිසුන් = 20 + 80 + 120 + 20 = 240.
- ලකුණු 40 ට වැඩි = 120 + 20 = 140.
- භාගය = 140/240 = 7/12.
Correct a mean after one value was misreported
 Data Representation and Prediction · Frequency Distributions
Median and interquartile range of 15 ordered values

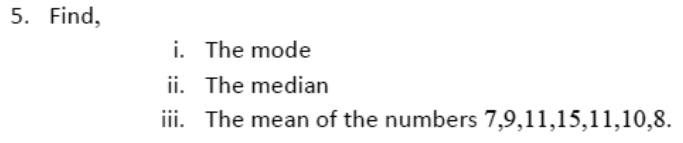
Mode, median and mean of seven numbers
 Data Representation and Prediction
Third quartile and IQR of twelve values
 Frequency Distributions · Data Representation and Prediction
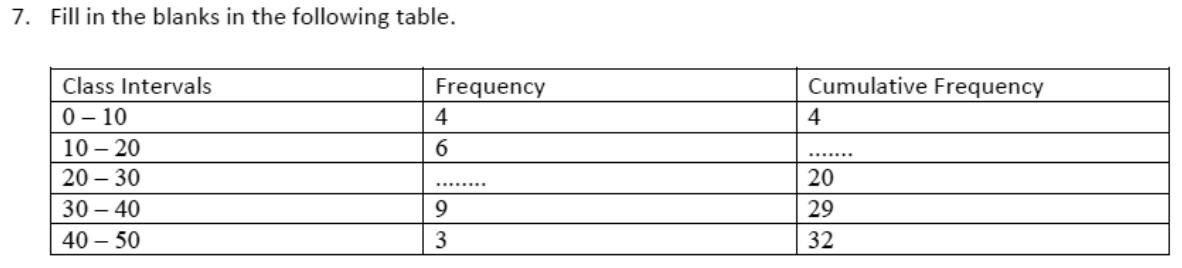
Complete a frequency and cumulative frequency table
 Data Representation and Prediction · Frequency Distributions
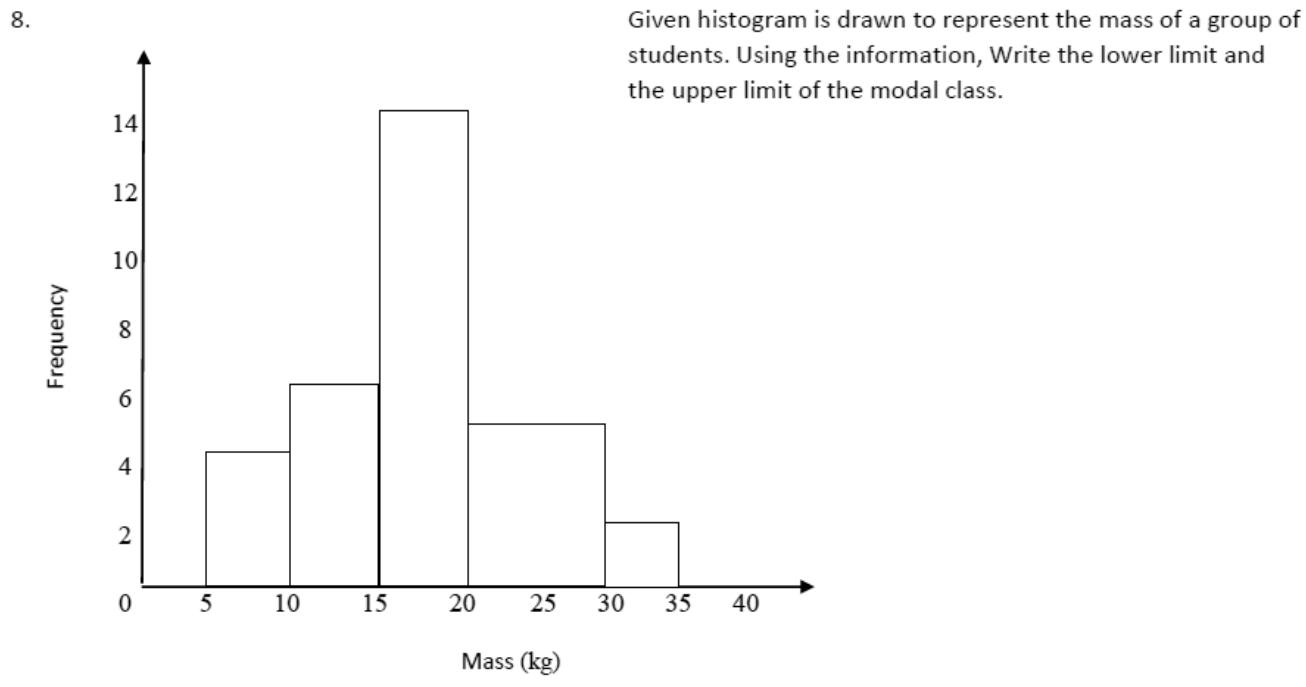
Modal class limits from a histogram
Class size and mid value of a grouped class

Median of eight unsorted marks
 Data Representation and Prediction
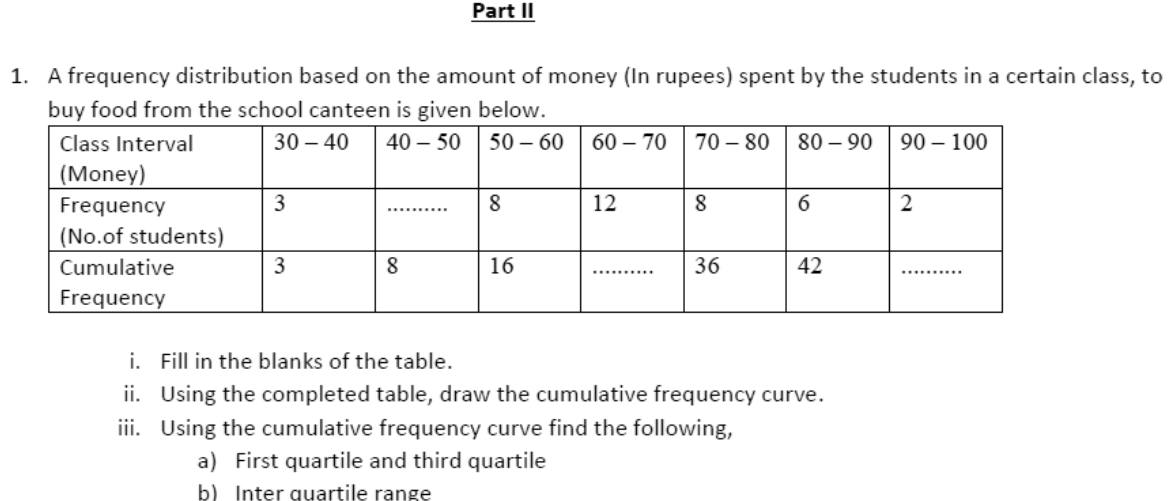
Complete table, cumulative frequency curve, quartiles and IQR
 Data Representation and Prediction
Histogram with unequal classes and frequency polygon
-0.jpg) Data Representation and Prediction
Data Representation and PredictionThree quartiles of fifteen ordered values
-0.jpg) Data Representation and Prediction · Data Representation
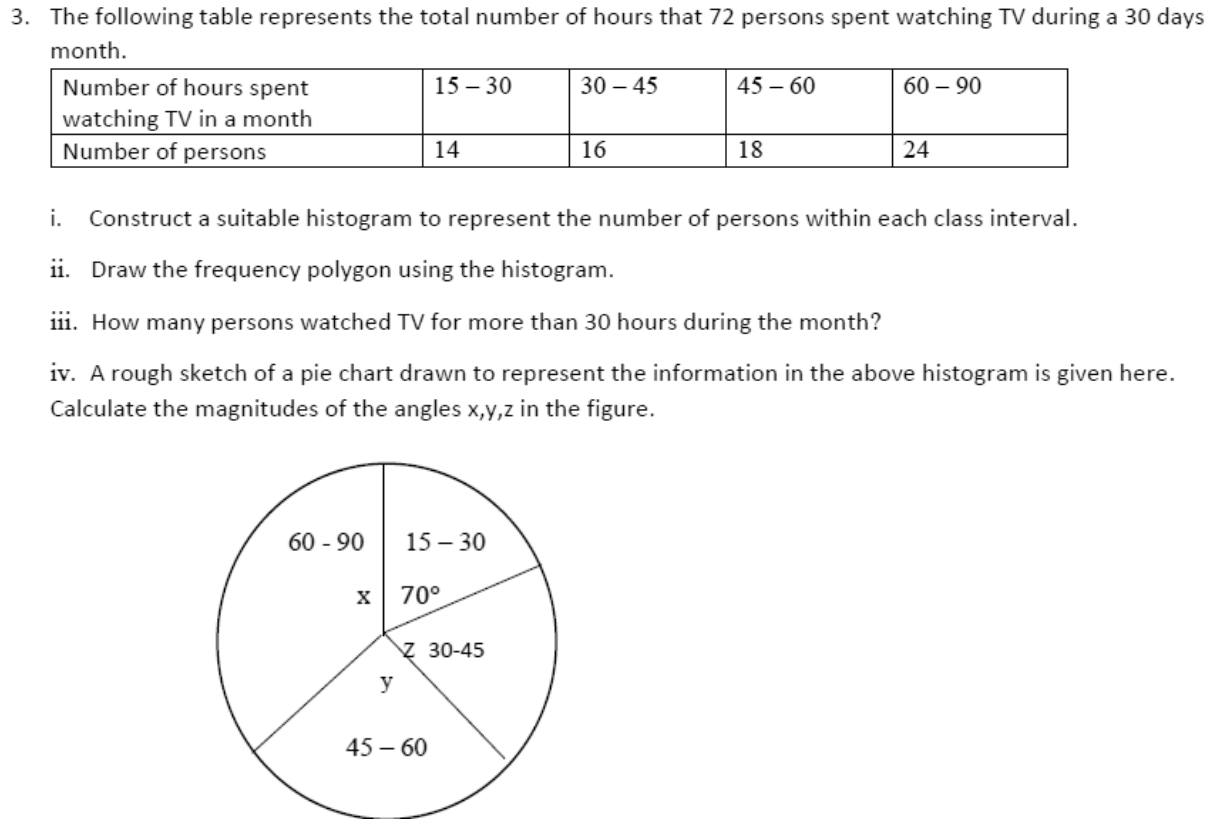
Data Representation and Prediction · Data RepresentationHistogram, polygon, count above a value, and pie chart angles