Paper I Part B Q4 · 10 marks
Data Representation · Data Representation and PredictionG.C.E. O/L 2025
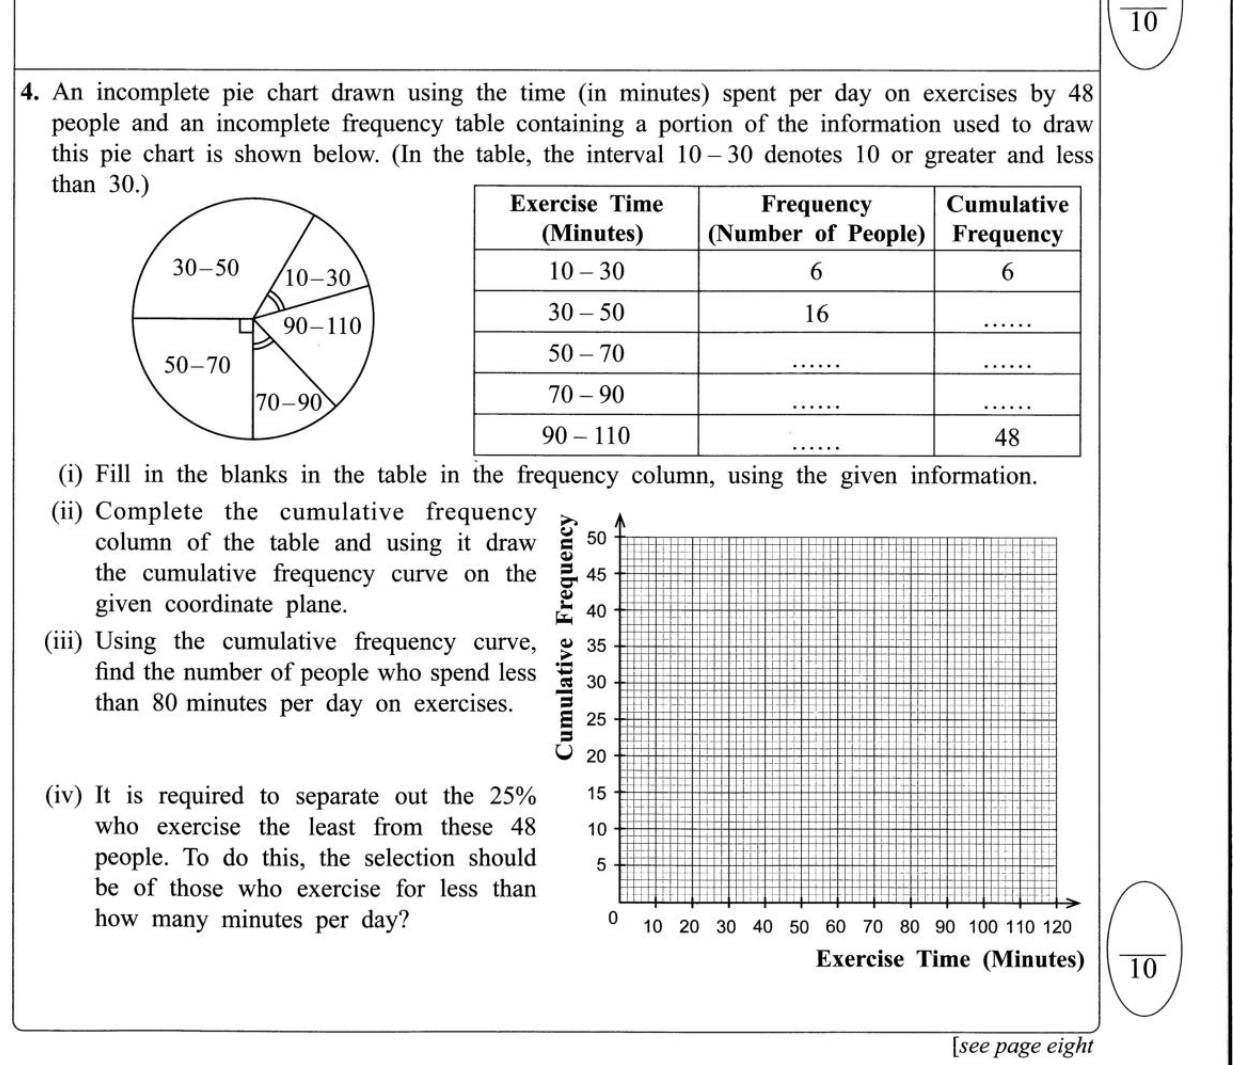
Pie chart to frequency table, ogive, reading values and lower quartile
 🔒 Answer & steps: try it free in Gedara Sir→
Short notes › Grade 10 · සිංහලෙන්
10 ශ්රේණිය · 10 පරිච්ඡේදය · දත්ත නිරූපණය
91%
of Grade 10 term tests include it (49 of 54)
519
marks in past papers (60 questions)
9 min
full lesson with quick checks
Sector angle = (amount ÷ total) × 360°
✅ 162°, 90°, 72°, 36°
✅ (i) 108° (ii) Rs 72,000 (iii) Rs 24,000
| Angles at the centre of a pie chart add up to… | 360° |
| Sector angle formula | Angle = amount ÷ total × 360° |
| Amount from a sector angle | Amount = angle ÷ 360° × total |
| A sector of 90° is what fraction of the whole? | One quarter (1/4). |
| Ratio 2 : 3 : 4. One part is how many degrees? | 360° ÷ 9 = 40° |
| 40 people in total. Angle for one person? | 360° ÷ 40 = 9° |
| What is a pie chart best for? | Comparing the parts of one whole. |
Now test yourself: 5 quick checks and 2 more worked examples
The full lesson checks your answers as you go, and Gedara Sir tracks which parts you've got.
G.C.E. O/L 2025
Pie chart to frequency table, ogive, reading values and lower quartile
🔒 Answer & steps: try it free in Gedara Sir→G.C.E. O/L 2024
Number in a pie-chart sector from another sector
 🔒 Answer & steps: try it free in Gedara Sir→
G.C.E. O/L 2019
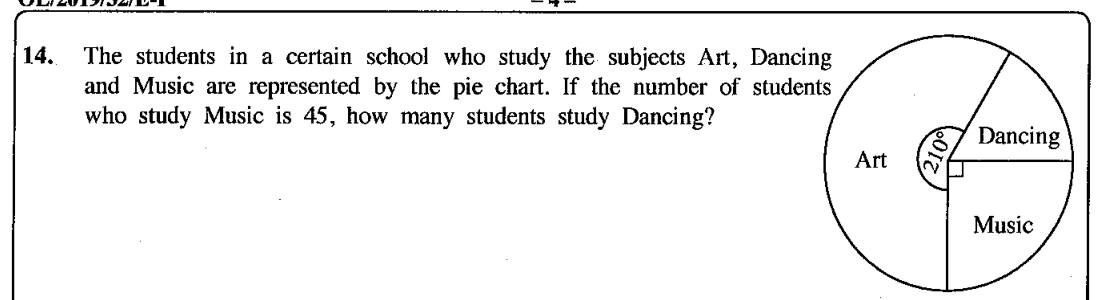
Number in a pie-chart sector from another sector's count
 🔒 Answer & steps: try it free in Gedara Sir→
G.C.E. O/L 2017
Total frequency from a histogram with unequal class widths
 🔒 Answer & steps: try it free in Gedara Sir→