Short notes › Grade 10 · සිංහලෙන්

Grade 10 Frequency Distributions: Short Notes

10 ශ්‍රේණිය · 25 පරිච්ඡේදය · සංඛ්‍යාත ව්‍යාප්ති

83%

of Grade 10 term tests include it (45 of 54)

473

marks in past papers (67 questions)

11 min

full lesson with quick checks

🎯 What you'll learn

  • Tell discrete data from continuous data
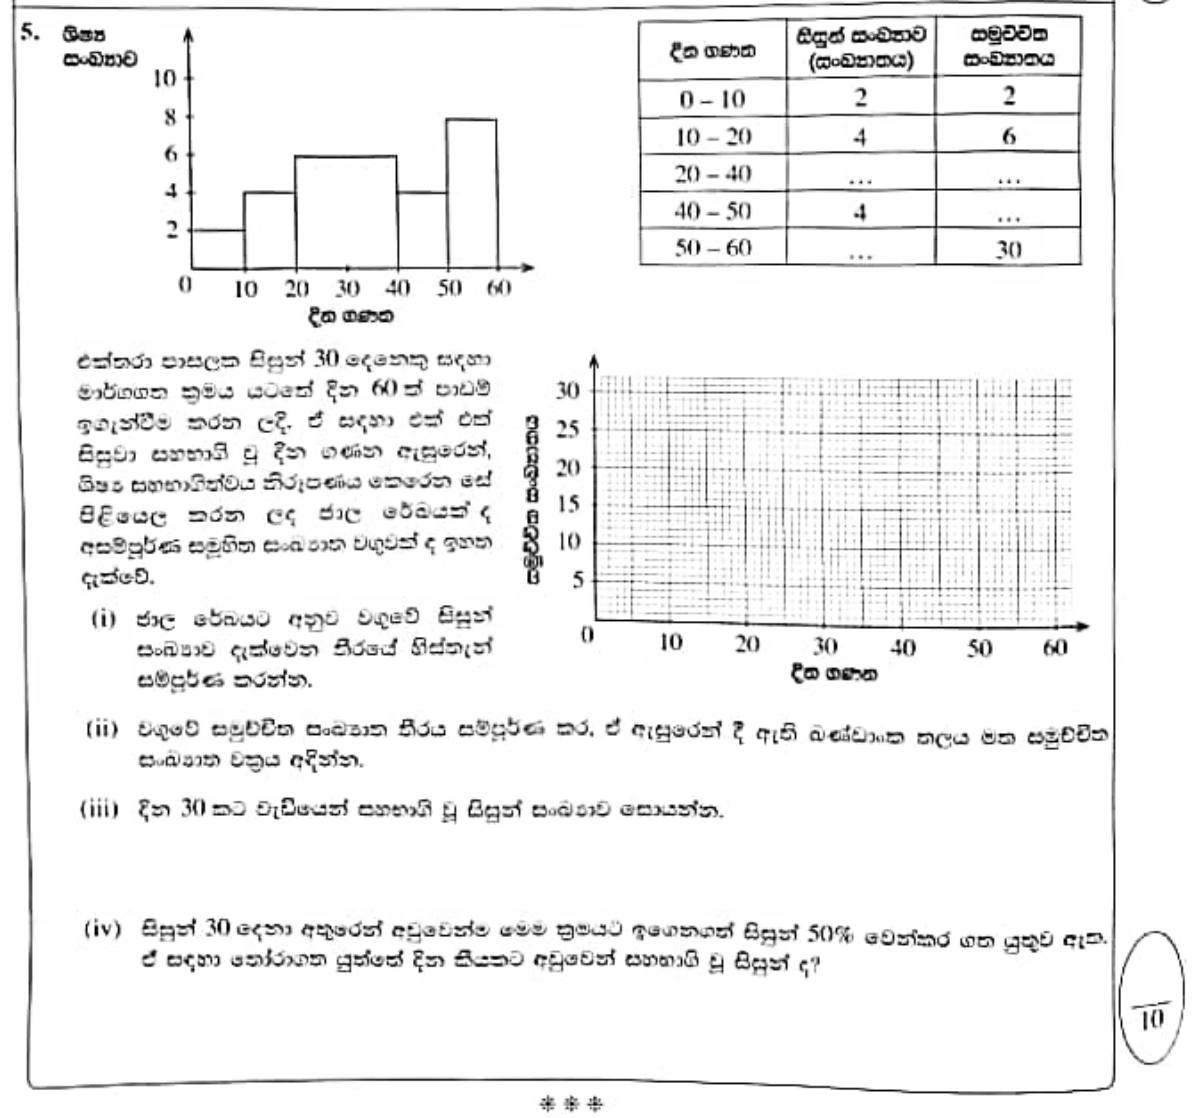
  • Find class size, mid-values and the modal class of a grouped table
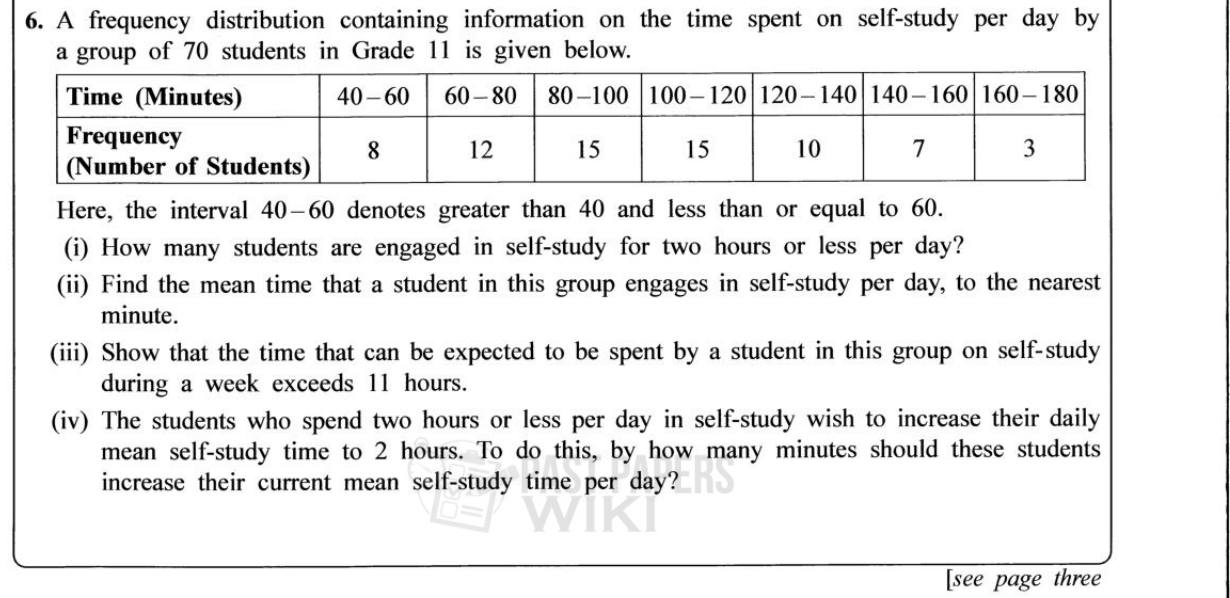
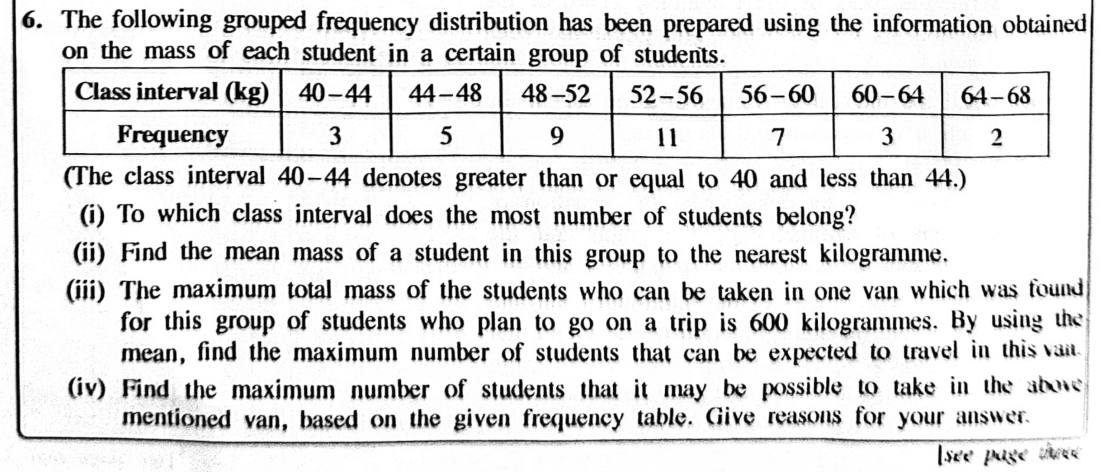
  • Find the mean of grouped data using mid-values
  • Find the mean using an assumed mean
  • Use the mean to estimate totals and plan

How much bread to bake?

A bakery owner in Kegalle sells a different number of loaves every day. Bake too many and they go stale; bake too few and customers walk to the next shop. A month of sales, grouped into a neat table, tells her the typical day and how much flour to order.

Discrete or continuous?

Discrete data are counted: they take separate values, usually whole numbers. Number of loaves, goals, family members.Continuous data are measured: they can take any value in a range. Mass of a jak fruit, height of a student, time to run 100 m.Ask yourself: did I count it or measure it?

Grouped frequency tables

When there are many different values, we group them into class intervals such as 10–19, 20–29, …• Frequency (f): how many values fall in the class.• Class size: 10–19 and 20–29 start 10 apart, so the class size is 10.• Mid-value (x): (10 + 19) ÷ 2 = 14.5. It stands for every value in that class.• Modal class: the class with the highest frequency.

🧮 Mean using mid-values

Multiply each mid-value x by its frequency f, add the fx column, then divide by the total frequency. We assume every value in a class sits at its mid-value, so the answer is an estimate.

x̄ = Σfx ÷ Σf

✏️ The bakery's 30 days

The table shows loaves sold per day at the bakery over 30 days. Find (i) the modal class (ii) the mean number of loaves sold per day.
fxfx10–19414.55820–29724.5171.530–391034.534540–49644.526750–59354.5163.5Σ301005
  1. 1(i) Highest frequency is 10, so the modal class is 30–39.
  2. 2(ii) Mid-values: 14.5, 24.5, 34.5, 44.5, 54.5.
  3. 3fx: 58, 171.5, 345, 267, 163.5; Σfx = 1005, Σf = 30.
  4. 4Mean = 1005 ÷ 30 = 33.5 loaves.

✅ (i) 30–39 (ii) 33.5

⚠️ Slips in the fx column

O/L examiners report the same slips year after year: wrong mid-values, wrong products in fx, and adding the wrong column. Protect yourself:• Check that Σf equals the number of days or people.• Multiply by the mid-value, never by a class limit.• Sanity check: the mean must lie inside the range of the data, near the modal class.

🧮 Mean using an assumed mean

Choose A as a mid-value near the middle, usually in the modal class. The deviations d are small numbers, so the multiplying is easier. Σfd can be negative.

x̄ = A + Σfd ÷ Σf, d = x − A

✏️ Same bakery, easier numbers

Find the mean loaves per day again, this time using the assumed mean A = 34.5.
fxdfd10–19414.5−20−8020–29724.5−10−7030–391034.50040–49644.5106050–59354.52060Σ30−30
  1. 1d = x − 34.5: −20, −10, 0, 10, 20.
  2. 2fd: −80, −70, 0, 60, 60.
  3. 3Σfd = −150 + 120 = −30.
  4. 4Mean = 34.5 + (−30 ÷ 30) = 34.5 − 1 = 33.5 ✓

✅ 33.5 loaves (same as before)

⚠️ Losing the minus sign

A popular wrong answer adds Σfd ÷ Σf when Σfd is negative. Keep the signs in the d and fd columns, add negatives and positives separately, then combine. Also, the assumed mean is only a shortcut: if the mid-values are small, the direct Σfx method is fine. Pick one method and do it carefully.

Using the mean to plan

The mean is a representative value: one number that stands for a typical day.• Estimate a total: total ≈ mean × number of days. 33.5 loaves a day means about 33.5 × 30 ≈ 1005 loaves a month.• Plan stock: days a stock lasts ≈ stock ÷ mean.It uses every value, which is its strength; but a few very large or small values can pull it away from the typical value.

📌 Remember

• Counted data are discrete; measured data are continuous.• Mid-value = (lower + upper) ÷ 2; modal class = highest frequency.• Mean = Σfx ÷ Σf, or A + Σfd ÷ Σf with d = x − A.• Keep signs in d and fd; check Σf and that the mean looks sensible.• Estimate totals with mean × number of days.

🧾 Quick revision sheet

Discrete dataCounted data with separate values (e.g. number of loaves).
Continuous dataMeasured data that can take any value in a range (e.g. mass, time).
Mid-value of a class(lower limit + upper limit) ÷ 2
Modal classThe class with the highest frequency.
Mean of grouped data (mid-values)x̄ = Σfx ÷ Σf
Mean with an assumed mean Ax̄ = A + Σfd ÷ Σf, where d = x − A
Estimating a total from the meanTotal ≈ mean × number of days (or people).

Now test yourself: 5 quick checks and 1 more worked examples

The full lesson checks your answers as you go, and Gedara Sir tracks which parts you've got.

Past paper questions on Frequency Distributions

Paper I Part B Q4 · 10 marks

Data Representation and Prediction · Frequency Distributions · Probability

G.C.E. O/L 2024

Read a frequency polygon into a table; histogram; cumulative frequency; probability
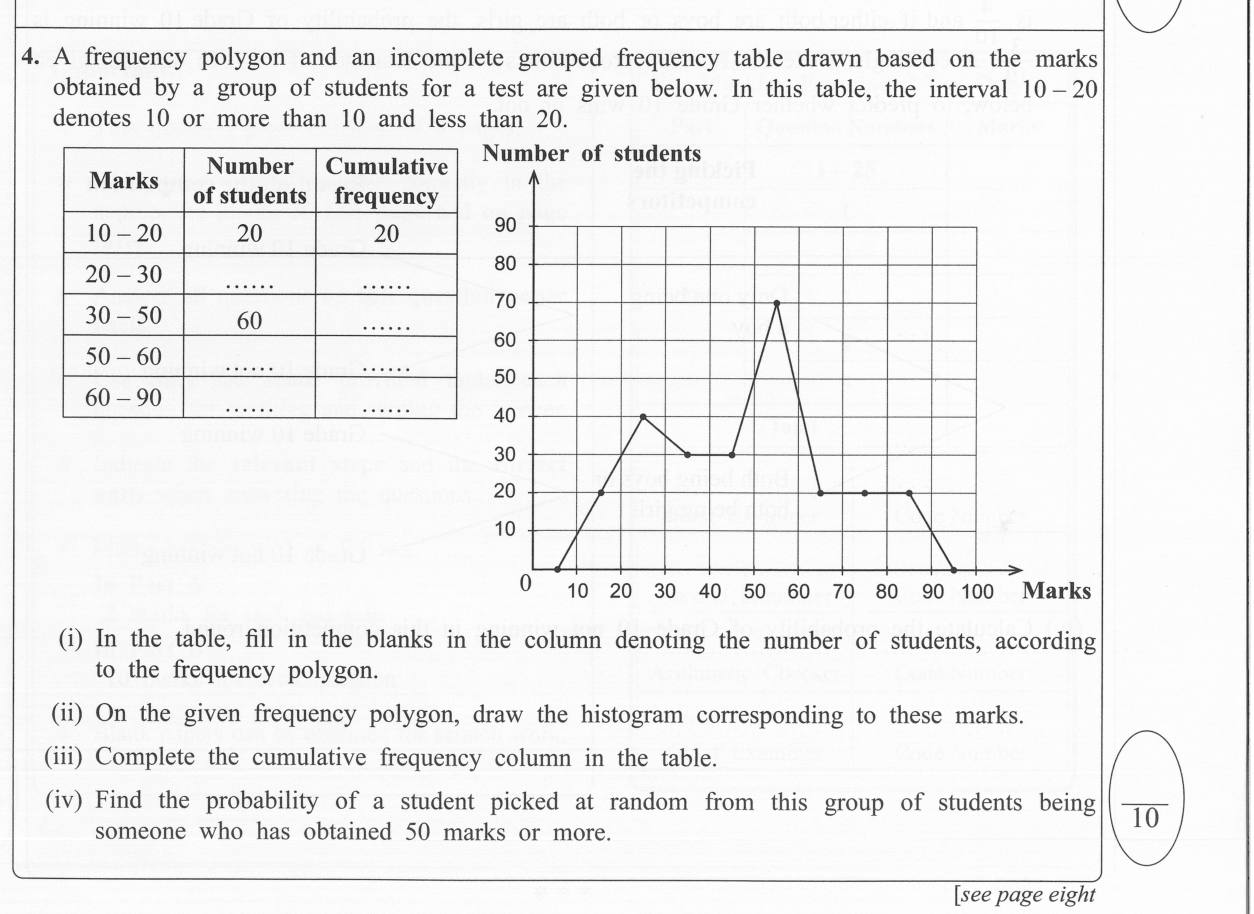
Paper I Part B Q4: Read a frequency polygon into a table; histogram; cumulative frequency; probability🔒 Answer & steps: try it free in Gedara Sir→

More Grade 10 notes