Short notes › Grade 9 · සිංහලෙන්

Grade 9 Data Representation and Prediction: Short Notes

9 ශ්‍රේණිය · 28 පරිච්ඡේදය · දත්ත නිරූපණය හා අර්ථකථනය

48%

of Grade 9 term tests include it (19 of 40)

209

marks in past papers (28 questions)

11 min

full lesson with quick checks

🎯 What you'll learn

  • Make a frequency distribution using tally marks
  • Group data into class intervals and state the class size
  • Find the mode, median, mean and range of a set of data
  • Find the mean of a frequency distribution with Σfx ÷ Σf
  • Find the modal class and median class of grouped data

Which size to stock?

Before school starts in January, a shoe shop in Nugegoda must decide which school-shoe sizes to order most. Last year's sales are a long list of numbers. Sorted into a neat table and summed up with one or two 'representative' values, that list tells the owner exactly what to do.

Frequency distributions

The frequency (f) of a value is how many times it appears.A frequency distribution is a table of each value (x) with its frequency.To build one, go through the data once and make a tally mark for each value. Every fifth mark is drawn across the previous four, so the marks come in easy-to-count groups of 5.

Children in 20 families

x is the number of children in a family and f is the number of families. Each crossed group counts as 5. The frequencies add up to 20, the number of families surveyed.
xf1427354351

Grouping with class intervals

When there are many different values (marks out of 50, say), a table of single values is too long. Group them into class intervals such as 0–9, 10–19, 20–29.The class size (width) of 10–19 is 10, since it holds 10 whole numbers.Classes must not overlap and must cover every value.

Four numbers that sum up data

Mode: the value that occurs most often.Median: the middle value once the data are in order.Mean: the sum of all values ÷ the number of values.Range: largest value − smallest value (it shows the spread).Mode, median and mean are representative values: one number that stands for the whole group.

✏️ A Grade 9 quiz

Nine students scored 15, 8, 17, 12, 15, 19, 11, 15, 14 out of 20 in a quiz. Find the mode, median, mean and range.
  1. 1In order: 8, 11, 12, 14, 15, 15, 15, 17, 19.
  2. 2Mode = 15 (it appears 3 times).
  3. 39 values, so the median is the 5th: 15.
  4. 4Mean = 126 ÷ 9 = 14.
  5. 5Range = 19 − 8 = 11.

✅ Mode 15, median 15, mean 14, range 11

Median of an even number of values

With n values in order, the median is the ((n + 1)/2)th value.• n = 9 → the 5th value.• n = 10 → the '5.5th', so take the mean of the 5th and 6th values.Example: 2, 4, 5, 8, 9, 12 has middle values 5 and 8, so the median is (5 + 8) ÷ 2 = 6.5.

⚠️ Order first, then find the middle

Two common slips with the median:1. Picking the middle of the list as given. For 10, 2, 14, 6, 7 that gives 14, but in order (2, 6, 7, 10, 14) the median is 7. Always order the data first.2. Giving the position instead of the value: 'the median is 5' when you mean 'the 5th value'.

🧮 Mean of a frequency distribution

Add an fx column (value × frequency). Σfx is the total of all the data; Σf is the number of data. Divide the first by the second.

x̄ = Σfx / Σf

✏️ Back to the 20 families

Use the table of children in 20 families (x = 1 to 5, f = 4, 7, 5, 3, 1). Find the mode, median, mean and range.
  1. 1Mode: the highest frequency is 7, at x = 2. Mode = 2.
  2. 2Median: 20 values, so the 10th and 11th. Running totals 4, 11: both are 2.
  3. 3Σfx = 4 + 14 + 15 + 12 + 5 = 50.
  4. 4Mean = 50 ÷ 20 = 2.5. Range = 5 − 1 = 4.

✅ Mode 2, median 2, mean 2.5, range 4

⚠️ Mode is a value, mean uses Σf

1. The mode is the value with the highest frequency, not the frequency. In the families table the mode is 2 children, not 7.2. For the mean, divide Σfx by Σf (20 families), not by the number of rows in the table (5). Dividing by 5 gives 10 children per family, which is clearly silly.

Modal class and median class

In a grouped table we can't see single values, so we name a class:• Modal class: the class with the highest frequency.• Median class: the class that holds the middle value. Find the position (n + 1)/2, then add the frequencies from the top (cumulative frequency) until you pass it.

📌 Remember

• Tally in groups of five; the fifth mark crosses the four.• Mode: most frequent value. Median: middle value after ordering, at position (n + 1)/2.• Mean = Σfx ÷ Σf. Range = largest − smallest.• Grouped data: modal class has the highest frequency; find the median class with cumulative frequencies.

🧾 Quick revision sheet

FrequencyThe number of times a value occurs in the data.
ModeThe value that occurs most often.
MedianThe middle value when the data are in order; position (n + 1)/2.
Mean of a frequency distributionx̄ = Σfx / Σf
RangeLargest value − smallest value.
Modal classThe class interval with the highest frequency.
Median classThe class that contains the middle value; find it with cumulative frequencies.

Now test yourself: 4 quick checks and 1 more worked examples

The full lesson checks your answers as you go, and Gedara Sir tracks which parts you've got.

Past paper questions on Data Representation and Prediction

Paper I Part A Q20 · 2 marks

Data Representation and Prediction · Frequency Distributions

North Western Province Grade 9 Maths Term 3 Test 2023

Modal class and median class of a grouped distribution
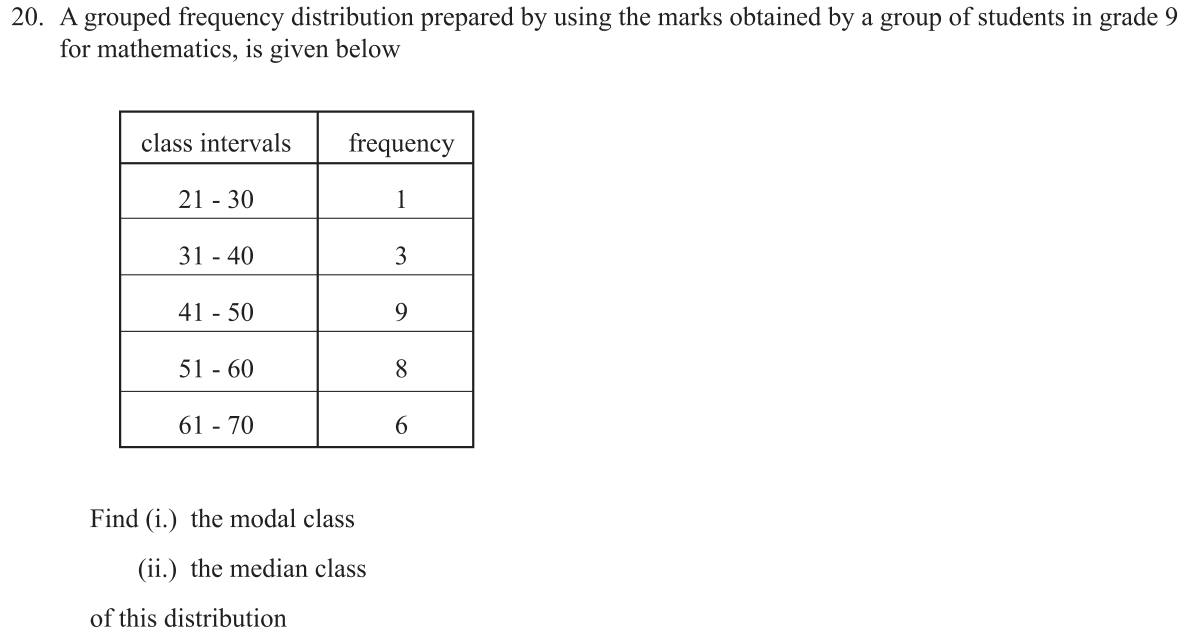
Paper I Part A Q20: Modal class and median class of a grouped distribution🔒 Answer & steps: try it free in Gedara Sir→

Paper I Part B Q3 · 11 marks

Data Representation and Prediction

Royal College, Colombo 07 (school paper, via pastpapers.wiki) Grade 9 Maths Term 3 Test 2023

Complete cumulative table; class size, modal class, range, median class
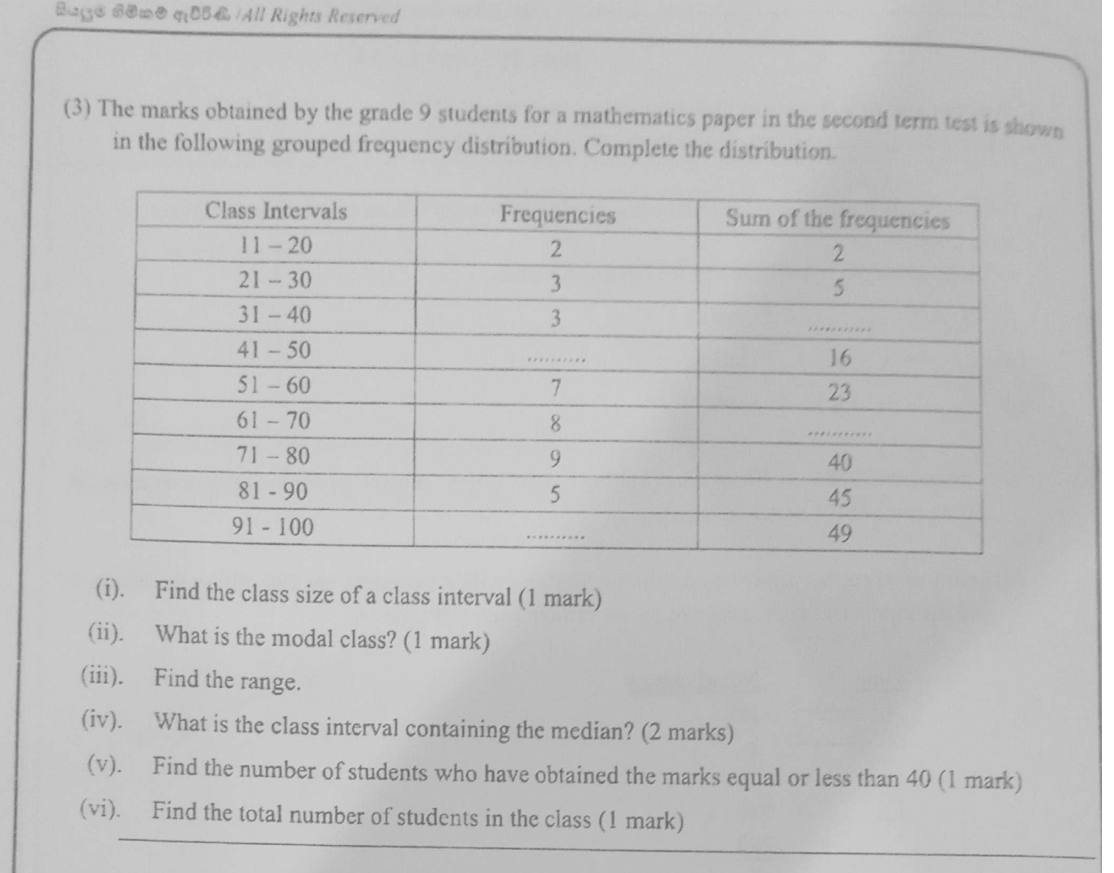
Paper I Part B Q3: Complete cumulative table; class size, modal class, range, median class🔒 Answer & steps: try it free in Gedara Sir→

More Grade 9 notes